Applying a Grouping |

|

|
|
Applying a Grouping |
|
|
Applying a Grouping |
|
|
|
Applying a Grouping |
|
|
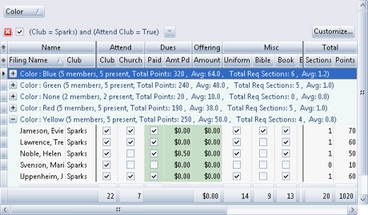
Another powerful tool for organizing and analyzing data within grids is grouping. Grouping records can be done using a single column or multiple columns. It is especially useful for getting record counts for individual groups. For example: How many Sparks are in your club? How many of each gender are in each grade? Using the grouping operation provides these answers in seconds!
|
To save a small amount of screen space when not using the grouping feature, go to the Grid Menu and uncheck the option to Show Group By Box. |
|
If grouping is possible for a grid, the area above the grid will say "Drag a column header here to group by that column". If that is not showing, check the Grid drop-down menu to see if it has been hidden. |
Drag a column header to use for grouping (the Check-in grid's Team Color, for example) and drop it in the area above the grid. The data in the grid will then be grouped according to the column header.
|
If a desired column is not currently displayed in the grid, learn how to make it visible. |
| • | To view the individual members within the groups, click the |
| • | To add a grouping within a grouping, drag another column header up to the grouping area. (For example, putting the Gender column under the Club Name column shows how many of each gender are in each club.) |
| • | To disable a grouping, drag the column header anywhere outside the grouping area. When a large black X is shown, then drop it. The column will reappear at its original location within the grid. |
|
Dropping the column header on top of other column headers in the grid will insert the column at that location (which might or might not be desired!) |